

Local Ranking Analysis With a Heat Map: How to Read a Grid Scan
A heat map from a grid scan shows where your business ranks near the top and where it falls behind. We explain the colors and the next steps to take.
By BadePlus
Images are AI-generated.
Two people running the same Google Maps search a few streets apart can see different results. So "where do we rank on the map?" has no single answer; it depends on where the search happens. A local ranking heat map answers it area by area: with searches from points around your business, it shows in one image where you rank high and where you fall behind.
Here we explain what a grid scan is, what its colors and numbers mean, how to choose grid size and distance, and how to turn the heat map into a concrete to-do list.
What is a grid scan?
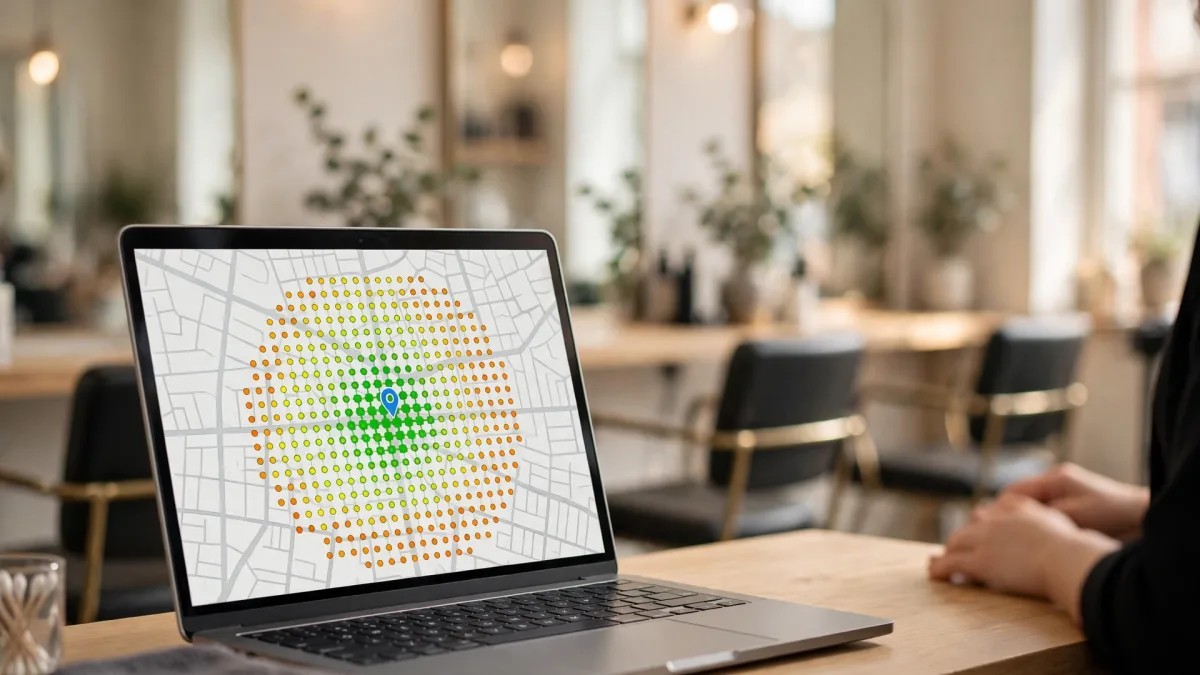
A grid scan measures from evenly spaced points around your business, which sits at the center. At each point, a result is fetched as if the same keyword had been searched there, and your position is recorded. The result is a colored map where each cell is a point; that's what a Google Maps heat map means.
This method removes the distortion of a single-point check. A search on your phone at your workplace shows only that point; a customer a few kilometers away may see something completely different. We explain how location affects measurement in detail in our article Measuring your Google Maps ranking accurately: why location matters.
Keep in mind: every scan is a snapshot. Google results can change over time, with the search phrase and with the searcher. So grid rank tracking gains meaning not from one scan but from scans repeated on the same settings.

What do the colors and numbers tell you?
The number in each heat map cell shows your position in a search from that point; the colors make it readable at a glance:
- Green shades: Top positions. Searchers at these points see you at the top of the list.
- Yellow and light orange: Middle positions. You're visible, but a bit lower in the list.
- Dark orange and near-red shades: Low positions.
- Cells showing "20+": Your business didn't appear in the top 20 there.
- Average rank: The average across all points. The lower the number, the better.
- Points in the top three: How many points place you among the top three results that stand out in the search.
- Points not found: The number of "20+" cells.
Choosing grid size and distance
A grid is defined by two settings: number of points and size of the area.
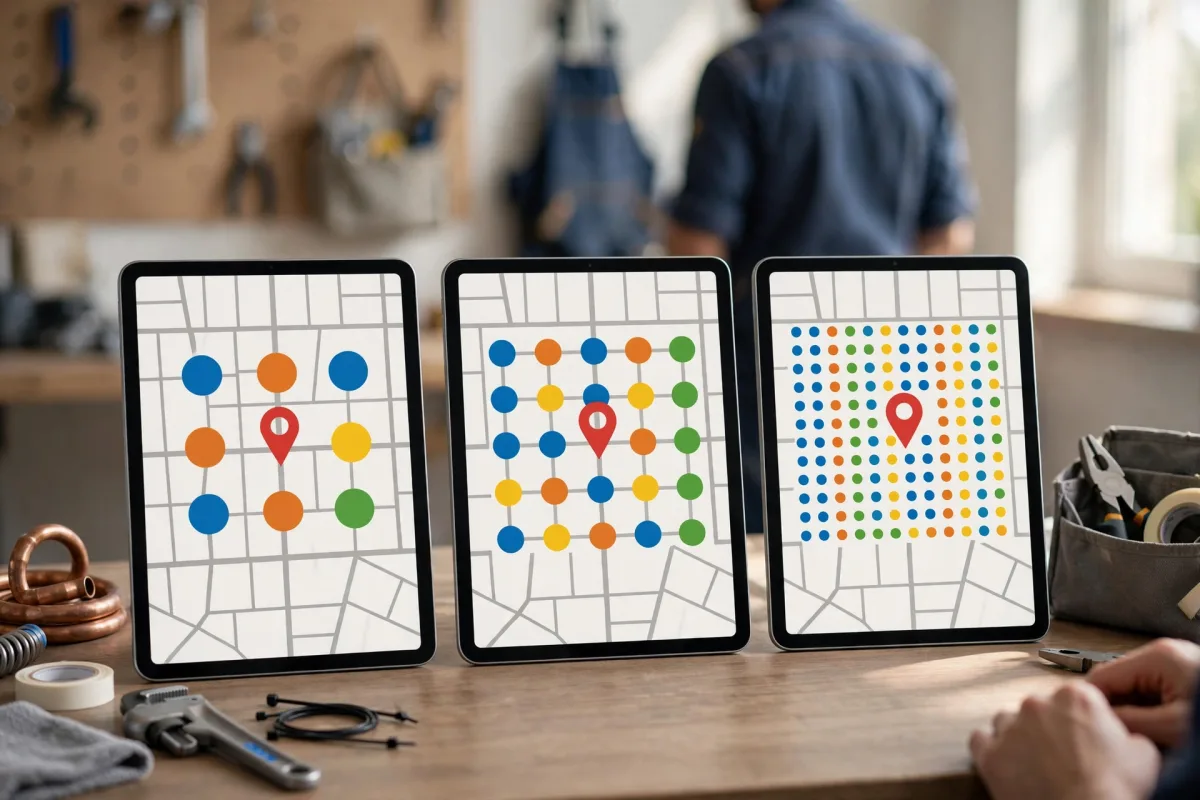
- Number of points: A 7×7 grid has 49 points, a 9×9 grid 81 and a 13×13 grid 169. More points measure the same area more finely; you see the transition between strong and weak areas more clearly.
- Area (radius): The distance from the center to the edge of the grid. Points spread evenly across it.
- For a cafe, bakery or hair salon people walk to, a narrow area (for example, 1 kilometer) is usually enough.
- For a restaurant or clinic drawing customers from its own and nearby neighborhoods, a medium area (for example, 2 to 5 kilometers) makes more sense.
- For service-area businesses that go to customers (tradespeople, repair services, movers), choose a wider area covering the region you serve.
Strong at the center, weak at the edges
The most common picture: green at and near your business, orange and red toward the edges. This is often expected. Google describes the three main factors behind local results as relevance, distance and prominence; details are on Google's tips to improve your local ranking page. Someone searching from the edge is shown businesses closer to that point; that's how the distance factor works.
Map ranking analysis really pays off in these situations:
- You're weak even at the center: If you rank low even at your own location, the problem is most likely relevance, not distance. Check whether your primary category matches this search and your services and description cover the topic. The keyword you chose may not describe your business at all.
- A clear weakness in one direction: If one side of the map is red, there may be a dense cluster of competitors there. Look at the categories, review counts and photos of businesses ranking high in that area.
- Scattered, island-like greens: An inconsistent picture tells you not to decide on a single scan. Look at the average of several scans.
- "20+" almost everywhere: The keyword may be too general, or your profile may not yet match this search.
From heat map to to-do list
A heat map is a diagnostic tool; the real value is the to-do list you draw from it. Proceed in these steps:
- Check the keyword. Is the phrase you're measuring the one your customers actually search for? A map for a keyword that doesn't describe your business tells you nothing.
- Strengthen relevance. Review your primary and additional categories, services, products and description. Describe your business clearly and completely, without keyword stuffing.
- Work on prominence. Ask customers for reviews regularly and within the rules, reply to reviews, add real photos; make sure your name, address and phone number appear the same way on your website and other listings.
- Look at the weak area. What do the businesses ranking high there do more completely on their profiles? Look not to copy, but to see your own gaps.
- Measure again on the same settings. After making changes, keep scanning with the same keyword, number of points and area. Rather than judging by one scan's difference, compare the average of the last few scans with earlier ones.
- Keep a record. Note which change you made on which date, so you can read changes on the map correctly.
BadePlus's map rank tracking scans with 7×7, 9×9 or 13×13 grids; on the map you see your rank at each point and the businesses ahead of you, with the trend over time.

Frequently asked questions
Why does the heat map come out slightly different with every scan?
Google results change over time; other businesses' profile changes, new reviews and the moment of the search can all affect it. Small fluctuations are normal; look at the trend, not a single scan.
Why is the rank I see on my phone different from the heat map?
Your phone searches from your own location, and the result may be personalized to you. A heat map measures every point the same way. The two answer different questions: one asks "what do I see here?", the other "how do I appear across my area?"
Summary
- A grid scan shows your rank area by area by running the same search from points around your business.
- Green means top positions, orange and red mean low ones; "20+" marks points where you didn't appear in the top 20. Look at the distribution, not the average.
- Choose the number of points and the area based on where your customers come from; always compare on the same settings.
- Strong at the center and weak at the edges is often normal; if you're weak at the center too, check relevance.
- Turn the map into a to-do list, record your changes and measure again on the same settings.